

Journal of Urban Design and Mental Health; 2020:6;13 (Advance publication 2019)
|
CITY CASE STUDY
|
Washington DC, USA: An Urban Design and Mental Health Case Study
Hana Burkly
Faculty of the Department of Global Health, School of Nursing and Health Sciences, Georgetown University
Faculty of the Department of Global Health, School of Nursing and Health Sciences, Georgetown University
Introduction
When Mayor Vincent Gray launched his Sustainable D.C. initiative in 2011, he proclaimed that he “wanted to make the District the healthiest, greenest, and most livable city in the nation” (Office of Planning and Department of Energy & Environment, 2012). Washington, D.C. is certainly on track to become these things, but not all parts of the city are equally healthy, green and livable. This paper aims to look at the city as a whole and as broken down by districts, to understand how geographically, Washington D.C. incorporates healthy design into its urban landscape. The second aim of this paper is to look at the mental health of the population of Washington, D.C. and, wherever possible, break down the mental health statistics by district to get a better understanding of what mental health issues are most prevalent in the city. Finally, this paper will seek to determine if there is any link between the urban design of D.C. and the mental health of its population. This is much easier said than done, as there is limited information on mental health statistics, and varying types of language used to describe mental health-friendly urban design.
It is important to note that as the nation’s capital, Washington D.C.’s land ownership is divided. Some parts of the city are federally owned lands, others are the city’s lands, and much is privately owned. This paper will focus primarily on the lands that are under the control of the D.C. Office of the Mayor, with some focus on the federally owned parks.
The policies of interest for this paper put forth by the Office of the Mayor fall into two categories. Either they explicitly mention mental health, but they do so in the context of mental illness, or they discuss strategies which have an implicit connection to mental health, such as designing greener spaces, encouraging active movement, or supporting an aging population which wishes to be self-supporting. For example, in its Community-Based Mental Health Action Plan for the District’s Youth and Young Adults, the D.C. Department of Mental Health (DMH) commits to “developing a system that supports individuals with mental illness in integrated, community-based settings” (DC Department of Mental Health, 2012), but does not have a similar statement addressing people who do not have explicit mental health needs.
Methods
This case study was developed using the Centre for Urban Design and Mental Health methodology based on the GAPS framework. GAPS stands for Green places, Active places, Pro-social places and Safe places. It was developed with the notion that these types of places have been demonstrated to be beneficial for people's mental health, and that the more components a city has, the better-equipped its population for mental health resilience. This paper will explore the many ways in which spaces can fit into the categories of green, active, pro-social, and safe spaces.
In order to begin to understand the historical and contemporary urban design of Washington, D.C., I spoke with representatives from various departments under the Mayor’s Office, such as the Department of Transportation and the Office of Disability Rights, as well as urban planners who were involved with projects in D.C. From these interviews, I gained the names and contact information of other people who might have relevant information, whom I then contacted. Through these conversations, I developed a more holistic understanding of the city from multiple perspectives, and a solid foundation of the history of D.C.’s urban design. Many of the people I spoke with also recommended specific documents to help me in my understanding of D.C.’s urban design, such as the Comprehensive Plan, which I read and searched through the references for further reading. Finally, I spoke with professors in the urban and regional planning department at the Georgetown University School of Continuing Studies, who provided information and further readings on designing for mental health in Washington, D.C. I then used these readings as a starting point to find further readings. These conversations and readings, collectively, informed my background of Washington, D.C.’s urban design and mental health landscape.
In order to begin to understand the historical and contemporary urban design of Washington, D.C., I spoke with representatives from various departments under the Mayor’s Office, such as the Department of Transportation and the Office of Disability Rights, as well as urban planners who were involved with projects in D.C. From these interviews, I gained the names and contact information of other people who might have relevant information, whom I then contacted. Through these conversations, I developed a more holistic understanding of the city from multiple perspectives, and a solid foundation of the history of D.C.’s urban design. Many of the people I spoke with also recommended specific documents to help me in my understanding of D.C.’s urban design, such as the Comprehensive Plan, which I read and searched through the references for further reading. Finally, I spoke with professors in the urban and regional planning department at the Georgetown University School of Continuing Studies, who provided information and further readings on designing for mental health in Washington, D.C. I then used these readings as a starting point to find further readings. These conversations and readings, collectively, informed my background of Washington, D.C.’s urban design and mental health landscape.
History of urban planning in Washington DC
In 1790, Congress passed the Residence Act, which authorized a federal district along the Potomac River that would ultimately become Washington, D.C. President George Washington commissioned Pierre L’Enfant, a French-American military engineer and urban planner, to design this new city. L’Enfant devised a master plan for the city, laid out in a gridlike fashion, with wide streets, large open spaces for public gatherings, and impressive monuments and buildings. At the center of the plan would be a 400-foot-wide “grand avenue,” which later became the National Mall. He envisioned people mingling on this grand avenue and participating in civil discourse (Fletcher, 2008).
In 1901, the U.S. Senate created the McMillian Commission, which used L’Enfant’s original city plan as a basis for the final design implementation of Washington, D.C. The commission was responsible for the planning of the system of parks that is in D.C. today. When construction began, much of the area was swampland and farmland (Gray, Urban design and mental health in Washington, D.C., 2018). Workers had to clear the land for the Mall and drain the swamp (Fletcher, 2008).
D.C. was designed to mirror a vision of a prosperous and growing country. When the streets were built, they had to take into account the natural topography and vistas, making sure that the views were broad enough to see the large monuments around the city. The greatest emphasis was placed on the National Mall and the area surrounding it. The original planners did an excellent job of creating the heart of the city, but as the city expanded and different populations moved in and out, the same level of care was not taken to develop and beautify the rest of it. As a result, the challenge facing urban planners today is to put the same level of care into the surrounding neighborhoods (DC Office of Planning, 2011).
Geography and demographics of Washington DC
Washington D.C. is surrounded by the states of Maryland to the northeast and Virginia on the southwest. It covers 68 square miles. At its center, it is mostly flat, with low hills to the north and south. The Potomac river separates D.C. from Virginia, and the Anacostia river runs through the eastern section (World Atlas, 2012).
Washington D.C. is divided into 8 wards (Figure 2). Historically, the Anacostia River has been a marker of a significant socioeconomic divide, though the demographics of the populations within each ward have also been distinct from one another. The area of land that is now much of Ward 8 was farmland during the time that the National Mall was being built. It was one of the first suburbs of D.C., founded in 1854 (Office of the Mayor, 2017).
Washington D.C. is divided into 8 wards (Figure 2). Historically, the Anacostia River has been a marker of a significant socioeconomic divide, though the demographics of the populations within each ward have also been distinct from one another. The area of land that is now much of Ward 8 was farmland during the time that the National Mall was being built. It was one of the first suburbs of D.C., founded in 1854 (Office of the Mayor, 2017).
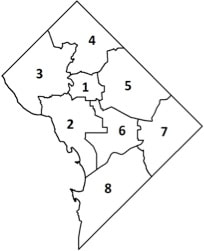
Figure 2: Map of D.C. by ward. Source: D.C. Office of Planning.
Throughout D.C.’s history, the greatest emphasis has always been placed on beautifying and developing the heart of the city, to the West of the Anacostia. As a result, the National Mall has become a widely recognized landmark of D.C. These efforts have often times pushed aside efforts to make similar improvements to the infrastructure of Wards 7 and 8, to the East of the Anacostia, creating inequity in investment in D.C.’s urban design.
In the past decade, the demographics of several neighborhoods have changed significantly. Shaw, Bloomingdale, and Navy Yard, in Wards 1, 5 and 6 respectively, are prime examples, having all experienced a major influx of working-aged adults, new infrastructure, job creation, and economic growth. However, one negative side effect of these positive social and economic gains has been the gentrification of these areas, with the original residents often being pushed out by rent increases and higher cost of living (NPR, 2017). This displacement of long term residents, many of whom grew up in the surrounding neighborhoods and have strong ties to the larger community as a whole through institutions such as school, church and extended family networks, could also result in a loss of social capital, leading to fewer “eyes on the street” who know what to look for.
Perhaps no region of D.C. has seen more rapid demographic change than Navy Yard. Located in Ward 6 in Southeast D.C., it is bordered by the Anacostia River on its southern border. From 2006 to 2015, the proportion of White residents in Navy Yard increased by 29 percent, the proportion of households earning over $100,000 increased by 18 percent, and the proportion of residents aged 22 to 34 increased by 15 percent (DataLensDC, 2017). These sociodemographic developments are examples of how parts of the city can rapidly change in a matter of years, changing the very landscape of those areas.
Currently, the population of Washington D.C. is 47.1% Black or African American, 36.8% White (non-Hispanic), 11.0% Hispanic, 4.3% Asian, 0.6% American Indian or Alaska Native, and 0.1% Native Hawaiian or Other Pacific Islander (United States Census Bureau, 2017). In 2017, Washington D.C. had a population of 693,972. This was the highest it had been in four decades, largely due to the high yearly influx of new residents. These have primarily been White, working-age adults earning high incomes. However, the new residents have not moved into all parts of D.C.. Rather, there has been a trend in a change in proportion of White residents within certain wards and not others. Furthermore, gentrification of what had been primarily Black neighborhoods has also changed the demographics of the wards over the years. From 2006 to 2015, D.C.’s central and Northeastern neighborhoods experienced an influx in White, wealthy, working-age residents, while proportions of White residents decreased along the western edge of the city, West of Rock Creek Park and East of the Anacostia River (DataLensDC, 2017).
During the same period, household incomes rose in almost every district, with especially high increases in the center of the city, such as Navy Yard and the Shaw and Howard University neighborhood clusters. East of the Anacostia River, several neighborhoods experienced a decrease in households earning over $100,000 a year. The overall picture is that in many neighborhoods that were already very high income, income continued to rise, while in areas with smaller proportions of high income earners experienced a further decline in wealth.
Leadership for health in the city
Muriel Bowser took office as the mayor of Washington D.C. in 2015. She was preceded by Mayor Vincent Gray, who was in office from 2011 to 2015. Mayor Gray put forth a multitude of ideas for the improvement of the infrastructure for health in D.C., most of which were described in his Sustainable D.C. Plan. The priority challenges discussed in this plan were jobs and the economy; health and wellness; equity and diversity; and climate and the environment (Office of Planning and Department of Energy & Environment, 2012). This plan continues to be implemented and updated under Mayor Bowser, and will be used throughout this paper
Mental health in Washington DC
Mental health and substance use disorders are the second leading cause of Disability Adjusted Life Years (DALYs) in D.C., after cardiovascular diseases (Figure 3). Fifteen percent of total DALYs in D.C. are caused by mental health and substance use disorders, and this number is on the rise (University of Washington, 2018). Between 1990 and 2016, DALYs attributable to mental health and substance use disorders increased by 75% (University of Washington, 2018).
The demographics of Washington D.C. are changing, and with those changes come shifts in the burden of disease. The last decade has seen a steady increase in the proportion of the population that is of working age. Among 15-49 year-olds in D.C. (which account for the largest proportion of the population, mean age 33.8), mental health disorders are the number one cause of DALYs, accounting for 29.57% of total DALYs.
The demographics of Washington D.C. are changing, and with those changes come shifts in the burden of disease. The last decade has seen a steady increase in the proportion of the population that is of working age. Among 15-49 year-olds in D.C. (which account for the largest proportion of the population, mean age 33.8), mental health disorders are the number one cause of DALYs, accounting for 29.57% of total DALYs.
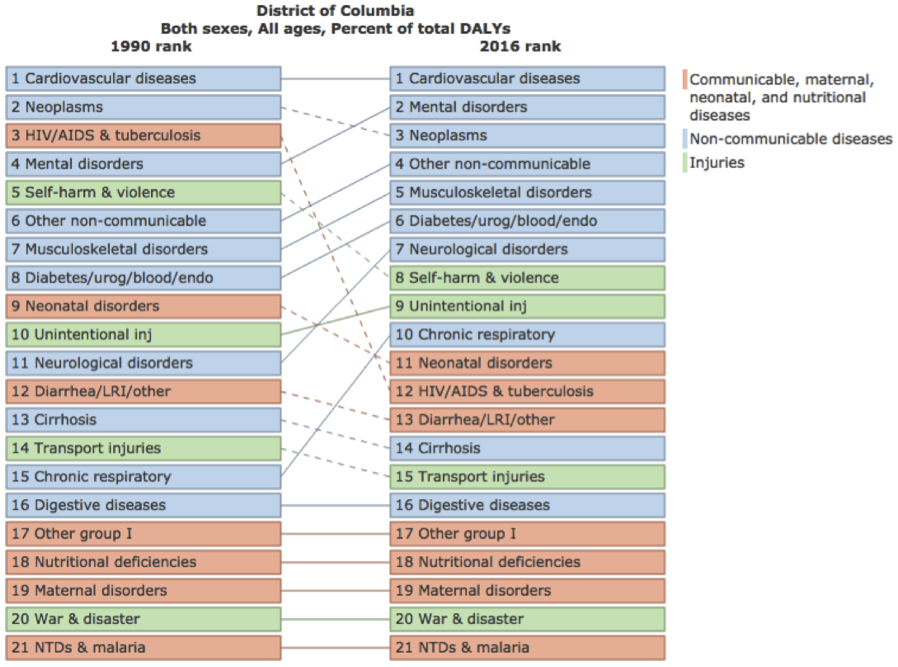
Figure 3: District of Columbia burden of disease information. Source: https://vizhub.healthdata.org/gbd-compare/
In 2018, an organization called Mental Health America created a “State of Mental Health” document for the United States, broken down by state. The document shows the prevalence of mental illness in the United States. The data collected were grouped into the following categories: Adults with Any Mental Illness (AMI); adults with dependence or abuse of illicit drugs or alcohol; adults with serious thoughts of suicide; youth with at least one past year major depressive episode (MDE); youth with dependence or abuse of illicit drugs or alcohol; and youth with severe depression (2017 state of mental health in America - Prevalence data, 2018). This document is one of the only comprehensive analyses of prevalence of mental illness in the U.S. broken down by state. In order to have an understanding of what Washington D.C.’s primary burden of mental illness lies, and to see how it compares to the nation, an in-depth analysis and summary of the document is necessary.
First, it is important to define the terms used in the “State of Mental Health” document. Adults with Any Mental Illness (AMI) is defined by SAMHSA as “having a diagnosable mental, behavioral, or emotional disorder, other than a developmental or substance use disorder” (Substance Abuse and Mental Health Services Administration, 2016). These can range from mild to severe. Adults with dependence or abuse of illicit drugs or alcohol includes those dependent on “marijuana/hashish, cocaine (including crack), heroin, hallucinogens, inhalants, or prescription-type psychotherapeutics used non-medically” (Substance Abuse and Mental Health Services Administration, 2013). When referring to youth with at least one past year major depressive episode (MDE), a major depressive episode is characterized by two or more weeks of feeling depressed, losing interest or pleasure in daily activities, and having difficulty sleeping, eating or concentrating (Substance Abuse and Mental Health Services Administration, 2016). Adults with serious thoughts of suicide is measured on an as-reported basis. Finally, youth with severe depression are identified as those who report experiencing difficulties in school, home and in relationships (2017 state of mental health in America - Prevalence data, 2018).
For the “State of Mental Health” rankings, the numbers range from 1 to 51 (reflecting the 50 states plus the District of Columbia). Higher numbers indicate worse outcomes. D.C. ranks 30th in terms of adults with AMI. 102,000 people, or 19.32% of the population, have any mental illness. This is slightly higher than the national average of 18.29% (43.7 million Americans). D.C. ranks the worst in terms of dependence or abuse of illicit drugs or alcohol, in 51st (last) place. The prevalence of dependence or abuse of illicit drugs or alcohol is 12.51% in D.C., as compared to 8.47% nationally. That translates to 66,000 people in D.C. The District ranks 16th in terms of adults with serious thoughts of suicide, with 3.91% having seriously contemplated suicide, or 21,000 people. This is about the same as the national average of 3.94%.
The percentage of youth reporting at least one past year major depressive episode in the past year across the United States has been increasing. D.C. has the lowest prevalence, at 8.69%, or 3,000 youth, as compared to the national average of 11.01%. However, it is certainly possible that a percentage of depressed youth go undiagnosed and untreated, especially in lower socioeconomic settings, where fewer resources are available.
D.C. ranks 3rd in terms of its percentage of youth who have reported a severe major depressive episode, with 5.5% prevalence (2,000 people), as compared to a national prevalence of 7.4%. However, the District ranks 41st in terms of youth with dependence or abuse of illicit drugs or alcohol. Currently, 5.63% of youth in D.C., or 2,000 people, struggle with alcohol or drug problems, compared to the national average of 5.13% (2017 state of mental health in America - Prevalence data, 2018).
In sum, as compared to national averages, D.C. ranks the worst in terms of dependence or abuse of illicit drugs or alcohol among both adults and youth. D.C. also has a worryingly high proportion of its population of adults with any mental illness. To further complicate the problem, it is important to note that mental illness is difficult to track and measure because most of the time, mental health issues are not visible on the outside and the data are mostly based on self-reported measures. So, these numbers could be far off from the actual numbers of people in D.C. with these health conditions.
Depression by Ward
There is not very much data available for mental health statistics in D.C. on a by-ward basis. However, D.C. does participate in the Behavioral Risk Factor Surveillance System (BRFSS), an annual, nationwide survey conducted over the phone that collects health data from residents in the fifty states and the District of Columbia (CDC, 2018). Results of those screenings in D.C. can be broken down by ward. The 2015 BRFSS screened for adults who had been previously diagnosed with a depressive disorder and found that 18% of D.C. residents had been diagnosed at some point in their lives (DC Department of Health, 2015).
When broken down by Ward, however, there were significant disparities, with 15.9-16.2% of residents in Wards 1 and 4 reporting having been diagnosed with a depressive disorder while 22.5-25.9% of residents in Ward 8 reporting having been diagnosed. These numbers are particularly striking considering that Ward 8 has the lowest access to primary care physicians who would make the diagnosis, and that even though White residents are slightly more likely to have been diagnosed with a depressive disorder than Black residents (19.4% vs. 18.7%, respectively), Ward 8, which is 92.8% Black, still had the highest rates of adults who were diagnosed with a depressive disorder (DC Department of Health, 2015). Figure 4 demonstrates diagnosis of a depressive disorder in adults by ward.
Depression diagnosis only tells a fraction of the story. Mental Health America also conducted a screening of depression in 2017 using phone interviews to survey a representative sample of participants from the 50 states and D.C. In addition to being asked whether they had been diagnosed with a depressive disorder, respondents were also given the Patient Health Questionnaire-9 depression screen which measures depressive symptoms. Respondents could then be categorized as having minimal, mild, moderate, moderately severe, or severe depression. Startlingly, 70% of respondents who had moderately severe and severe depression according to the screen reported never having been diagnosed by a medical professional (Mental Health America, 2017). This statistic demonstrates that the numbers obtained through looking solely at diagnosed cases are most likely a gross understatement of the true burden of mental illness.
Homelessness and Mental Health
Aside from the “State of Mental Health” and BRFSS data, little is known about per-state or -city mental health. However, there are proxies which can serve as indicators of mental health more generally. Homelessness is one such indicator.
Homelessness and poor mental health are closely tied. It is difficult to know what the general population’s mental health outcomes are because many people often go undiagnosed, but the population of people experiencing homelessness can sometimes serve as a proxy for the severest of cases since having a severe mental illness can make it difficult to keep a job and perform other functions necessary for keeping a home, thus leading many people with mental illness to eventually become homeless. By some estimates, between 30 and 50% of people experiencing homelessness have a severe mental illness, mainly psychoses, acute anxiety and personality disorders (Scott, 2018). Substance abuse comorbidities, such as alcohol or drug dependence, may be as high as 70% among the homeless (Salkow & Manfred, 2003). Homelessness then further exacerbates mental illness, as people are left feeling powerless and robbed of their dignity (Burn, 1992). This becomes a vicious cycle that keeps people on the streets instead of getting them treatment to break the cycle of homelessness.
One of Mayor Bowser’s priorities was to close down D.C. General, D.C.’s main homeless shelter, and replace it with smaller shelters, one in each ward. However, things did not go as planned and although D.C. General shut down, the new shelters were not opened in time, leaving many on the streets (Murphy & Tseu, 2018). Homelessness is not equally distributed across the wards of D.C. Unemployment, a risk factor for becoming homeless, is 17% in Ward 8 and 19% in Ward 7. In comparison, it is 4% in Ward 2 and 3.4% in Ward 3 (Office of Planning and Department of Energy & Environment, 2012). Poverty, another factor which is closely correlated to homelessness, is similarly divided among wards. 35% of Ward 8 residents and 26% of Ward 7 residents live in poverty. In contrast, 6.9% of residents in Ward 3 and 9.9% of residents in Ward 4 live in poverty.
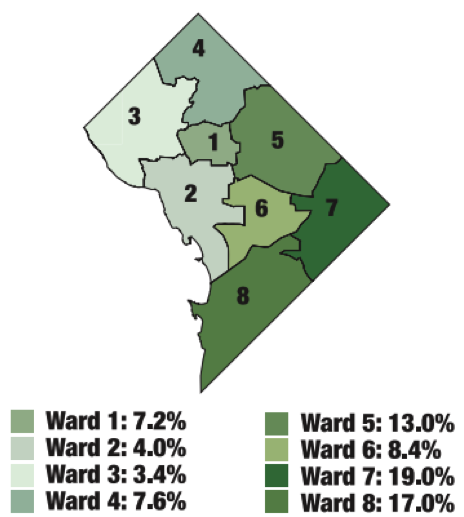
Figure 5a: Unemployment by ward (2005-2009). Source: Sustainable DC.
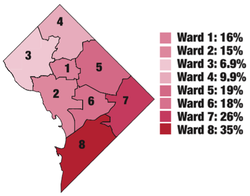
Figure 5b: Poverty prevalence by ward (2005-2009). Source: Sustainable DC.
During Mayor Gray’s administration, the Government of the District of Columbia Department of Mental Health Supportive Housing Strategic Plan 2012-2017 was created. This document outlines a plan to support people experiencing mental illness find housing that can provide what they need, instead of being put in an institution, and is currently undergoing revisions.
GAPS-friendly urban design in Washington DC
Green Spaces
As noted earlier, green space refers to “an area of grass, trees, or other vegetation set apart for recreational or aesthetic purposes in an otherwise urban environment” (Google, 2018). There are many areas of land which qualify as green space under this definition. National and local parks are the most obvious of these. Since they are open to the public and are part of government land (whether federal or district owned), this section will focus mostly on parks.
Local and National Parks
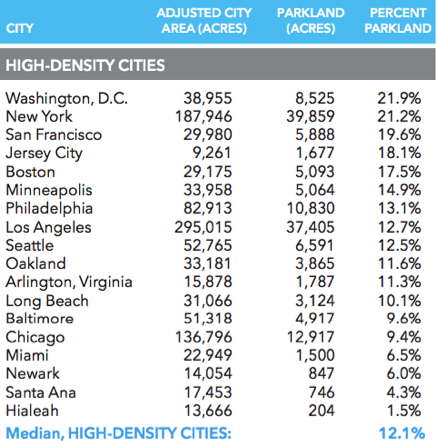
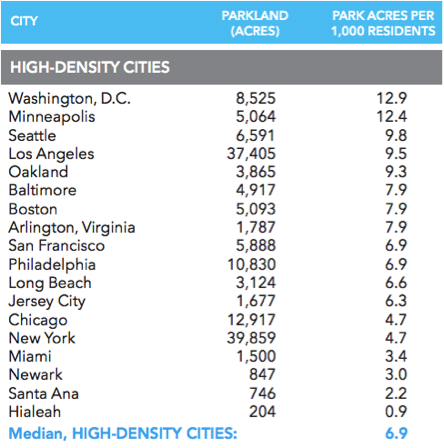
According to a 2017 report by the Trust for Public Land, Washington D.C. ranked #1 in the nation in terms of parkland percentage and parkland per 1,000 residents (The Trust for Public Land, 2017) (Figure 6). D.C. has 8,525 acres of parkland, accounting for 21.9% of its adjusted city area (which excludes airport and railroad acreage from total city land area). This translates to 12.9 acres of parkland for every 1,000 D.C. residents.
As noted earlier, green space refers to “an area of grass, trees, or other vegetation set apart for recreational or aesthetic purposes in an otherwise urban environment” (Google, 2018). There are many areas of land which qualify as green space under this definition. National and local parks are the most obvious of these. Since they are open to the public and are part of government land (whether federal or district owned), this section will focus mostly on parks.
Local and National Parks
According to a 2017 report by the Trust for Public Land, Washington D.C. ranked #1 in the nation in terms of parkland percentage and parkland per 1,000 residents (The Trust for Public Land, 2017) (Figure 6). D.C. has 8,525 acres of parkland, accounting for 21.9% of its adjusted city area (which excludes airport and railroad acreage from total city land area). This translates to 12.9 acres of parkland for every 1,000 D.C. residents.
|
|
Figure 6: Parkland as a percentage of adjusted city area and parkland per 1,000 residents by city. 2016 data. Source: The Trust for Public Land. (Parkland includes city, county, metro, state, and federal parkland within the city limits. Adjusted city area subtracts airport and railyard acreage from total city land area.)
Local parks are areas of land set aside by the city to allow for the public to enjoy nature. They are designed to be handicap-accessible and are regularly maintained. Washington, D.C. has successfully implemented 23 community conservation and recreation projects since 1987, and currently D.C. is home to hundreds of local parks which are maintained by the city (NPS, 2017). These parks provide areas not only for District residents to enjoy nature and greenery, but they also promote physical activity and social interaction. Walking through the downtown area, it is easy to see that D.C. is a very green city. However, while local parks proliferate most of D.C., they are not evenly distributed. As seen in Figure 7, Ward 8 has abysmally few local parks as compared to the rest of the city. Certainly, not all residents of Ward 8 live within walking distance of a local park, and thus cannot benefit from the positive mental health outcomes of spending time in a park.
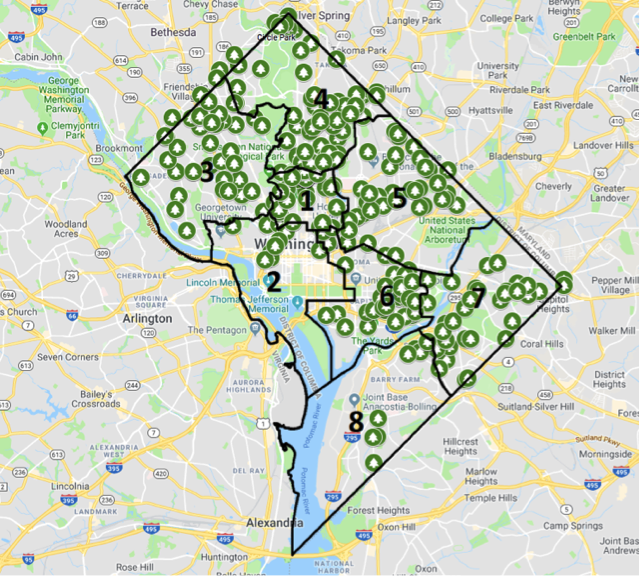
Figure 7: Local parks in D.C.. Source: D.C. Department of Parks and Recreation.
Aside from local parks, another source of public land with an abundance of green space is national parks. National parks are federally-owned lands which have been dedicated to conservation of the natural environment for the public to enjoy. The District has 25 national parks within its borders. It boasts 42,459,338 visitors to its national parks per year (NPS, 2017). If local parks are obviously unequally distributed, national parks are less so, perhaps because they are larger and thus more likely to span multiple wards. As seen in Figure 8, Wards 2, 3, 4 and 7 have the most acreage of national park space, and Ward 2 has the highest percentage of national park space. Ward 8 does not stand out as starkly as lacking park space when looking at national parks, as there are several parks which are included within Ward 8’s borders. However, as will be discussed in the next section, without adequate public transportation, walkability, or bikeability, it can be difficult to reach what few parks do exist in Ward 8.
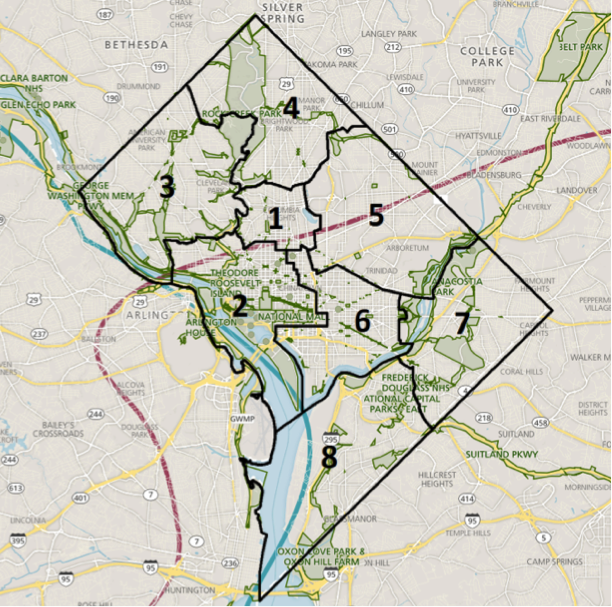
Figure 8: National parks in and around Washington, D.C. Source: NPS.gov.
Contemporary Efforts to Expand Green Space
A keystone of Mayor Gray’s administration, being updated under Mayor Bowser’s administration, is Sustainability DC, an action plan for making D.C. the “healthiest, greenest, and most livable city in the nation” (Office of Planning and Department of Energy & Environment, 2012). This document proposed many goals and targets for the year 2032. Included in the nature targets are to “cover 40% of the District with a healthy tree canopy” and “provide parkland or natural space within a 10-minute walk of all residents” (Office of Planning and Department of Energy & Environment, 2012).
Mayor Muriel Bowser’s administration was committed to continuing the efforts begun by Mayor Vincent Gray. In 2018, Mayor Bowser spearheaded the redesign of public space into what became Petworth Meditation Garden in Ward 4. The garden was designed to be available to all, with wheelchair-accessible pathways through the park, space for a community garden, drinking fountains for people and pets, bike racks, seating benches along the paths and central space, and a vegetated buffer. The project was community-led, with the goal of bringing people together (D.C. Office of the Mayor, 2018). This is just one example of the projects that Mayor Bowser initiated in order to facilitate community-building, especially in underserved areas of D.C.
Active spaces
In the Sustainable DC Plan, Goal #1 of health and wellness is to “inspire healthy, active lifestyles for all residents regardless of income, ability, or employment” (Office of Planning and Department of Energy & Environment, 2012). The Mayor’s Office plans to tackle this issue by increasing access and use of public parks and promoting healthy lifestyles through physical exercise.
Two ways that active spaces can be measured is through walkability and bikeability. These are measures of how easy it is to walk and bike from one place to another. For some people, going to a gym is a way to get physical activity. For many others, however, physical activity is built into the tasks of daily life, such as getting to and from work or school, and running errands. Thus, if these activities can be accomplished conveniently through walking or biking, people may end up incorporating greater physical activity simply by doing everyday activities, and thus reap the benefits of daily physical activity. A third measure which can correlate with increased daily physical activity is the availability of public transport, since using public transport often includes walking short distances to catch a bus or train, and then walking from the drop off spot to the actual destination.
|
According to Walk Score, Washington D.C. is very walkable, fairly bikeable, and has good transit (Walk Score, 2018). It scored 77 out of 100 on walkability, meaning that most errands can be accomplished by foot. However, this number is an average, and as seen in Figure 9, walkability varies considerably depending on where in the city a person lives. In downtown D.C., the area is nearly all green on the map, meaning that it is easy and convenient to walk. However, looking at the area east of the Anacostia River, there are hardly any green areas, meaning that walking may not be a realistic choice when people are deciding how to get to and from work, school, or running errands.
|
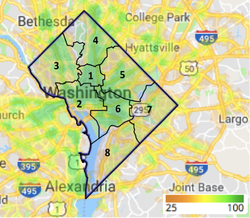
Figure 9: Washington, D.C. Walk Score Map, 2018 Google Maps, WalkScore.com
|
|
D.C. scored 68 out of 100 on transit, meaning that though there are many nearby public transportation options in most parts of the city, there are areas where public transit is not as convenient or affordable as it might be in other parts. As seen in Figure 10, a person can travel quite far in the middle of the city using public transportation, but this becomes more difficult if one is traveling further away from the city’s center. Ward 8, in particular, is not reached very much by public transportation and thus its residents may be limited in their accessibility to D.C.’s public transportation system.
|
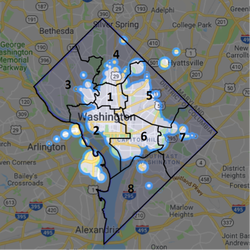
Figure 10: Washington, D.C. Transit Time Map, 2018 Google Maps, WalkScore.com. This map shows how far one can travel in 30 minutes from Washington, D.C. on public transit.
|
D.C. scored 67 out of 100 on bikeability, meaning that there is some bike infrastructure, but there are areas in which biking can be challenging or inconvenient. As with walkability and public transport, bikeability varies considerably by location within D.C. Currently, D.C. boasts 56 miles of bike lanes, most of which are concentrated in the center of D.C. In addition, it has 55 additional miles of trails, many of which lead out of the city and into the suburbs (Office of Planning and Department of Energy & Environment, 2012).
When broken down by neighborhood, D.C.’s walk, transit, and bike scores differ significantly. Figures 11a and 11b summarize the top five and bottom five neighborhoods in terms of aggregated walk, transit, and bike scores.
When broken down by neighborhood, D.C.’s walk, transit, and bike scores differ significantly. Figures 11a and 11b summarize the top five and bottom five neighborhoods in terms of aggregated walk, transit, and bike scores.
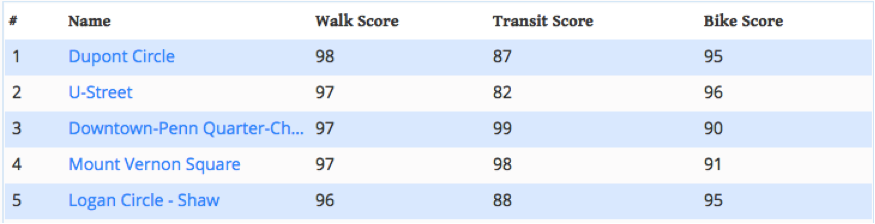
Figure 11a: Top 5 neighborhoods in D.C. for walkability, transit, and bikeability. Source: Walkscore.com
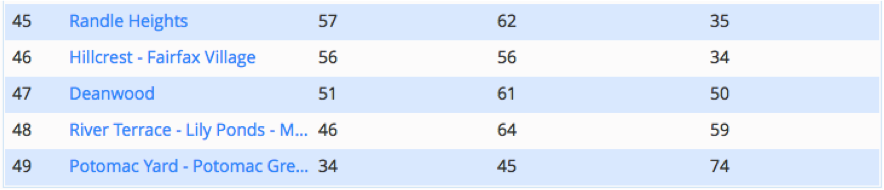
Figure 11b: Bottom 5 neighborhoods in D.C. for walkability, transit, and bikeability. Source: Walkscore.com
Among the top five neighborhoods for walkability, transit, and bikeability in Washington D.C., two (U-Street and Logan Circle) are in Ward 1 and three (Dupont Circle, Penn Quarter, and Mount Vernon Square) are in Ward 2, with Mount Vernon Square and Logan Circle also encompassing part of Ward 6. Among the bottom five neighborhoods, all but the Potomac Yard neighborhood are in Ward 7. The Potomac Yard neighborhood technically is not in D.C., but rather in Alexandria, Virginia, which is part of the metropolitan region of D.C.
Sustainability D.C. created several transportation targets, including increasing the use of public transit to 50% of all commuter trips, increasing biking and walking to 25% of all commuter trips, and reducing commuter trips made by car or taxi to 25% (Office of Planning and Department of Energy & Environment, 2012). Whether it will be able to meet those targets remains to be seen. More importantly that meeting the aggregate targets, however, will be increasing access to active transportation options in the specific Wards in which currently there is very little.
Sustainability D.C. created several transportation targets, including increasing the use of public transit to 50% of all commuter trips, increasing biking and walking to 25% of all commuter trips, and reducing commuter trips made by car or taxi to 25% (Office of Planning and Department of Energy & Environment, 2012). Whether it will be able to meet those targets remains to be seen. More importantly that meeting the aggregate targets, however, will be increasing access to active transportation options in the specific Wards in which currently there is very little.
Pro-social Spaces
As mentioned previously, the definition for pro-social spaces that will be used in this paper is places within the built environment where people can gather and interact, with a focus on the realm under the control of the city government. As the nation’s capital, Washington D.C. is known for its pro-social spaces, from museums to monuments, many of which are open to the public free of charge. However, as with so many other aspects of the GAPS framework, the distribution and type of pro-social places differs significantly across the city.
One of Washington D.C.’s proudest attractions is its network of seventeen Smithsonian museums, in addition to the National Zoological Park, all of which are free to the public (Smithsonian, 2018). These are excellent gathering spaces for social interaction. The Smithsonian institutions also regularly put on special interactive exhibits or educational events which are especially beneficial to families with children.
In addition to events put on by the Smithsonian institutions, free events regularly occur often in and around the National Mall (elongated grassy open park-type area) which promote social interaction. Protests and marches happen on the steps of the Supreme Court, in front of the White House, on the National Mall, and other locations with high visibility in the heart of the city. While sometimes portrayed as divisive, these gatherings provide the opportunity for people of similar identities to find others who share their passions.
In the literature on pro-social spaces in D.C., it is interesting to note that when referencing the city, many authors stick to what is available in the center, and do not make very much mention of the outskirts, especially not anywhere East of the Anacostia River. In a document published by the Office of the Mayor, the authors list several urban design elements which they argue promote social interaction and a feeling of cohesion for D.C.’s residents. They emphasize that these elements need to be applied to all parts of D.C., and not just the city’s center:
The District of Columbia has several programs which are targeted at under-served neighborhoods in D.C. and contribute to the development of pro-social places. One such project is the Healthy Corner Store Program, in which D.C. partners with local neighborhood shops to increase affordability and availability of fresh produce for people living in under-served neighborhoods (DC Central Kitchen, 2018). This program would not only decrease the food deserts in D.C.’s low-income communities, but it would promote the development of social capital as people would be encouraged to walk to and from the grocer, and thus meet and develop bonds with their neighbors and local businesses. Furthermore, it aligns with one of the Sustainable DC targets, which is to provide local food within half a mile of all residents of D.C. (Office of Planning and Department of Energy & Environment, 2012). As part of the goal is to source the produce locally, the Healthy Corner Store Program would encourage the use and expansion of community gardens in recreation centers and other government-owned properties in D.C.
The Anacostia Waterfront Initiative is another program which may benefit those in under-served communities and allow more people to access pro-social places. This project is focused on creating new parks, pedestrian crossings, and better transportation infrastructure along the Anacostia River (DC Office of the Mayor, 2018).
In Sustainability DC, one of the targets for the built environment is to “provide a variety of amenities and services within a 20-minute walk of all residents” (Office of Planning and Department of Energy & Environment, 2012). Within the target to provide a variety of amenities and services within walking distance is the action to “ease permitting requirements for temporary arts, community, and business uses.” This would allow for more opportunities to create temporary spaces of gathering, which would be instrumental in increasing social capital in the neighborhoods in which they take place. Another of the actions is to “convert five vacant buildings into permanent cultural or business incubation centers,” focusing on revamping buildings to the East of the Anacostia, in Wards 7 and 8. Business incubation centers provide the opportunity for small businesses to develop and grow. This initiative would take buildings which are currently unlivable and turn them into hubs of activity.
Another initiative which encourages pro-social placemaking is the “Live Near Your Work” grants. These were begun by the Office of Planning with the intent to incentivize people to live close to their workplaces so that they could walk to work. This would reduce car idling and traffic, and would encourage the development of social capital as people begin to recognize faces along their way to work. The grants are in the form of a subsidy which go to people who buy a house near where they work. This is especially important since walkable neighborhoods tend to be the least affordable to live in (Office of Planning and Department of Energy & Environment, 2012). Of course being able to walk to work is ideal, and many people would live close to their work places if they could. The city would have to provide quite generous subsidies if it is to genuinely support low-income residents in their housing and work needs.
Restaurants and retail shops can be unexpected hubs of social activity within communities (Merlo, Bell, Menguc, & Whitwell, 2006). Humans have communed together since prehistory. Dining together is an important part of socializing in nearly every culture, and in communities where most of the shops are locally owned, it is part of the very fabric of the identity of the residents (Dunbar, 2007). Though this paper primarily focuses on the built environment that is under the control of the city, looking at the distribution of privately owned businesses, specifically restaurants, can help paint a picture of potential social gathering places.
In addition to the mental health benefits of being able to socialize with others in the community through dining together, there are other benefits of having restaurant choices. Living in a food desert has been linked to lower levels of social capital and perceived control (Dean, 2011). These factors directly link to poorer mental health, as people find comfort in feeling a sense of control about certain aspects of their lives, especially food, which is a basic need and is often deeply engrained in culture and identity.
Dining out need not be expensive, either. Typically, the more choices are available, the better natural competition can happen between restaurants to ensure that prices are kept low. It is important to note, however, that not everyone can afford to eat out, and that this itself can provide a barrier to the positive social capital gains that are linked to communal dining even if the community has many options. Thus, more efforts should be made by the city and federal government to provide subsidized communal dining experiences so that all may benefit from its capability to build social capital and improve mental health.
As seen in Figure 12, restaurant choices are significantly more limited in Wards 7 and 8, which may exacerbate the problem of affordability when there are fewer options from which to choose. Conversely, Wards 1 and 2 are saturated with options for dining out.
As mentioned previously, the definition for pro-social spaces that will be used in this paper is places within the built environment where people can gather and interact, with a focus on the realm under the control of the city government. As the nation’s capital, Washington D.C. is known for its pro-social spaces, from museums to monuments, many of which are open to the public free of charge. However, as with so many other aspects of the GAPS framework, the distribution and type of pro-social places differs significantly across the city.
One of Washington D.C.’s proudest attractions is its network of seventeen Smithsonian museums, in addition to the National Zoological Park, all of which are free to the public (Smithsonian, 2018). These are excellent gathering spaces for social interaction. The Smithsonian institutions also regularly put on special interactive exhibits or educational events which are especially beneficial to families with children.
In addition to events put on by the Smithsonian institutions, free events regularly occur often in and around the National Mall (elongated grassy open park-type area) which promote social interaction. Protests and marches happen on the steps of the Supreme Court, in front of the White House, on the National Mall, and other locations with high visibility in the heart of the city. While sometimes portrayed as divisive, these gatherings provide the opportunity for people of similar identities to find others who share their passions.
In the literature on pro-social spaces in D.C., it is interesting to note that when referencing the city, many authors stick to what is available in the center, and do not make very much mention of the outskirts, especially not anywhere East of the Anacostia River. In a document published by the Office of the Mayor, the authors list several urban design elements which they argue promote social interaction and a feeling of cohesion for D.C.’s residents. They emphasize that these elements need to be applied to all parts of D.C., and not just the city’s center:
- Strengthening civic identity through a renewed focus on assets such as public spaces, boulevards, and waterfront areas
- Designing for successful neighborhoods and large site reintegration
- Improving the public realm, particularly street and sidewalk space
- Addressing infrastructure and other barriers that affect aesthetic qualities
- Promoting design excellence throughout the city (DC Office of Planning, 2011).
The District of Columbia has several programs which are targeted at under-served neighborhoods in D.C. and contribute to the development of pro-social places. One such project is the Healthy Corner Store Program, in which D.C. partners with local neighborhood shops to increase affordability and availability of fresh produce for people living in under-served neighborhoods (DC Central Kitchen, 2018). This program would not only decrease the food deserts in D.C.’s low-income communities, but it would promote the development of social capital as people would be encouraged to walk to and from the grocer, and thus meet and develop bonds with their neighbors and local businesses. Furthermore, it aligns with one of the Sustainable DC targets, which is to provide local food within half a mile of all residents of D.C. (Office of Planning and Department of Energy & Environment, 2012). As part of the goal is to source the produce locally, the Healthy Corner Store Program would encourage the use and expansion of community gardens in recreation centers and other government-owned properties in D.C.
The Anacostia Waterfront Initiative is another program which may benefit those in under-served communities and allow more people to access pro-social places. This project is focused on creating new parks, pedestrian crossings, and better transportation infrastructure along the Anacostia River (DC Office of the Mayor, 2018).
In Sustainability DC, one of the targets for the built environment is to “provide a variety of amenities and services within a 20-minute walk of all residents” (Office of Planning and Department of Energy & Environment, 2012). Within the target to provide a variety of amenities and services within walking distance is the action to “ease permitting requirements for temporary arts, community, and business uses.” This would allow for more opportunities to create temporary spaces of gathering, which would be instrumental in increasing social capital in the neighborhoods in which they take place. Another of the actions is to “convert five vacant buildings into permanent cultural or business incubation centers,” focusing on revamping buildings to the East of the Anacostia, in Wards 7 and 8. Business incubation centers provide the opportunity for small businesses to develop and grow. This initiative would take buildings which are currently unlivable and turn them into hubs of activity.
Another initiative which encourages pro-social placemaking is the “Live Near Your Work” grants. These were begun by the Office of Planning with the intent to incentivize people to live close to their workplaces so that they could walk to work. This would reduce car idling and traffic, and would encourage the development of social capital as people begin to recognize faces along their way to work. The grants are in the form of a subsidy which go to people who buy a house near where they work. This is especially important since walkable neighborhoods tend to be the least affordable to live in (Office of Planning and Department of Energy & Environment, 2012). Of course being able to walk to work is ideal, and many people would live close to their work places if they could. The city would have to provide quite generous subsidies if it is to genuinely support low-income residents in their housing and work needs.
Restaurants and retail shops can be unexpected hubs of social activity within communities (Merlo, Bell, Menguc, & Whitwell, 2006). Humans have communed together since prehistory. Dining together is an important part of socializing in nearly every culture, and in communities where most of the shops are locally owned, it is part of the very fabric of the identity of the residents (Dunbar, 2007). Though this paper primarily focuses on the built environment that is under the control of the city, looking at the distribution of privately owned businesses, specifically restaurants, can help paint a picture of potential social gathering places.
In addition to the mental health benefits of being able to socialize with others in the community through dining together, there are other benefits of having restaurant choices. Living in a food desert has been linked to lower levels of social capital and perceived control (Dean, 2011). These factors directly link to poorer mental health, as people find comfort in feeling a sense of control about certain aspects of their lives, especially food, which is a basic need and is often deeply engrained in culture and identity.
Dining out need not be expensive, either. Typically, the more choices are available, the better natural competition can happen between restaurants to ensure that prices are kept low. It is important to note, however, that not everyone can afford to eat out, and that this itself can provide a barrier to the positive social capital gains that are linked to communal dining even if the community has many options. Thus, more efforts should be made by the city and federal government to provide subsidized communal dining experiences so that all may benefit from its capability to build social capital and improve mental health.
As seen in Figure 12, restaurant choices are significantly more limited in Wards 7 and 8, which may exacerbate the problem of affordability when there are fewer options from which to choose. Conversely, Wards 1 and 2 are saturated with options for dining out.
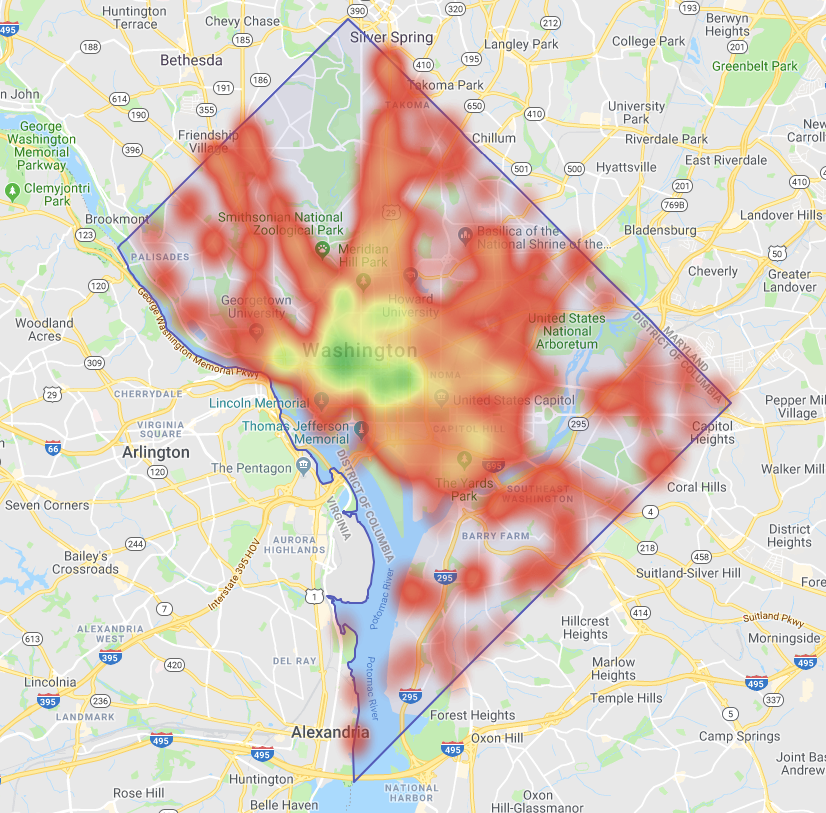
Figure 12: Concentration of restaurant choices in Washington, D.C. Source: WalkScore.com
Safe Spaces
The Mayor’s Office understands the importance of urban design in promoting safety. As part of its Sustainability D.C. plan, it states, “we envision a District where…our neighborhoods will provide safe, comfortable homes and access to essential services so all residents can lead healthy and prosperous lives” (Office of Planning and Department of Energy & Environment, 2012). While parts of D.C. are fairly safe, there are pockets of D.C. in which violent crime is still quite high. Overall, residents in D.C. have a 1 in 83 chance of being a victim of a violent crime over their lifetimes (Location Inc, 2017). By comparison, residents in Chicago have a 1 in 90 chance of being a victim, and in Philadelphia, they have a 1 in 101 chance.
Depending on where they live, D.C.’s residents feel differing levels of safety in their communities. According to a 2015 survey, residents living in wards 2, 5, 7 and 8 were significantly less likely to feel safe in their neighborhoods during the day than residents of wards 1, 3, 4 and 6 (Community Preservation and Development Corporation, 2016). Out of all the wards, residents living in Ward 8 felt the least safe in their neighborhoods, followed closely by Ward 7. Figures 13a and 13b demonstrate the stark contrast in perceptions of safety between residents to the East of the Anacostia River (Wards 7 and 8) and residents to the West (all other wards). Fewer than half of the residents of Wards 7 and 8 feel safe during the day on their streets and on public transportation, while in the other wards, perceptions of safety on the streets and on public transportation are above 60%. Strikingly, only 44% of respondents from Ward 8 felt safe outside on the streets in their neighborhood during the day, and this number dropped to 15% at night.
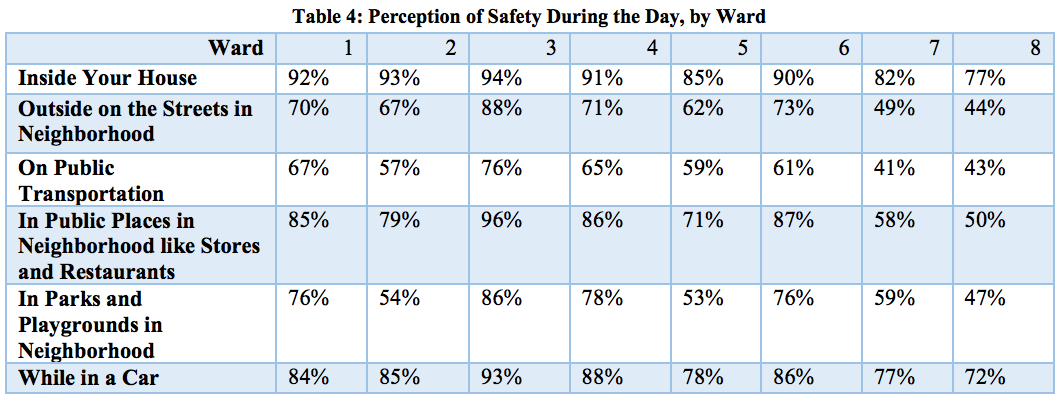
Figure 13a: Perceptions of safety during the day, by ward. Source: Community Preservation and Development Corporation, 2016.
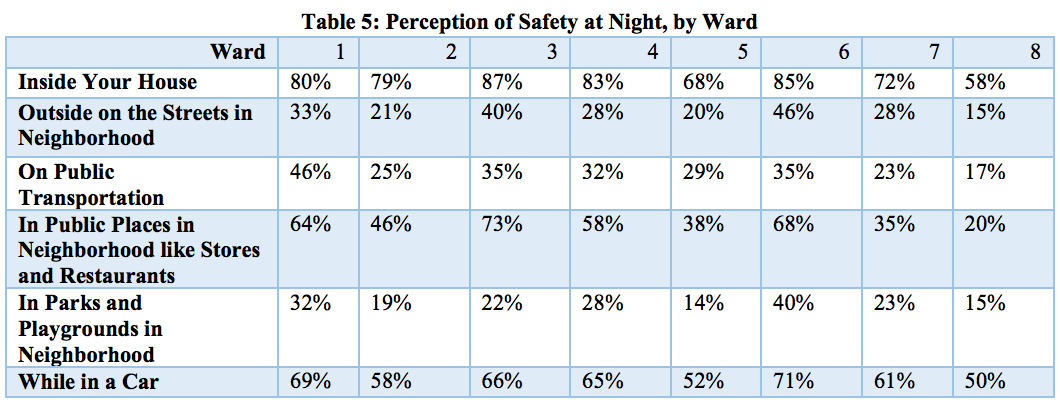
Figure 13b: Perceptions of safety at night, by ward. Source: Community Preservation and Development Corporation, 2016.
These numbers paint a deeply troubling picture. Not only do residents of Wards 7 and 8 have fewer GAPS-friendly design elements than the other wards, but in addition, the residents do not feel safe in those spaces. If people do not feel safe in parks, buses, or restaurants, or even their own neighborhood streets, then they will be disincentivized to spend time in these places. In fact, the only places in which 50% or more of residents in Wards 7 and 8 feel safe at night is their homes and cars. These are the two places in which people receive very little contact with greenery, are not required to be active, and do not necessarily promote social behaviors. Thus, for the more than 50% of the population that feels unsafe in the parks, neighborhood streets, restaurants, and other social, active, green spaces, the presence of these components does not help them receive any of the mental health benefits since they are disincentivized to use them. This is essential for key decision-makers who want to implement mental health-friendly design to understand. The GAPS components must all be present and work in unison for the full positive mental health effects to take place.
There are several initiatives by the city to improve the safety of D.C. residents through urban design. For example, a report released by the Community Preservation and Development Corporation listed seven recommendations for improving public safety and community-police relations. Recommendation number 4 directly addresses the role of the built environment in improving safety: “Environmental approaches to improving public safety should be more fully incorporated into public safety plans” (Community Preservation and Development Corporation, 2016). These include improving lighting in parks and on streets and setting up cameras in strategic locations to deter crime. Another example comes from one of the goals outlined in Sustainable DC, which aims to “create safe environments that are conducive to healthy living” (Office of Planning and Department of Energy & Environment, 2012). Embedded in that is to “develop a ‘healthy by design’ program for new affordable housing projects, with priority focus in low-income and underserved neighborhoods.” Hopefully, these initiatives will increase the real and perceived safety of residents East of the Anacostia River so that people can utilize the green, active, and pro-social spaces in their communities.
Schools as Safe Places
Children in D.C. spend an average of 7 hours a day, 181 days a year in school (NCES, 2008). Given that they spend much of their lives in school buildings, many resources should be allotted to keeping children safe in school and school-related activities. Surprisingly, there are not many publicly available documents that analyze school safety from an urban design perspective. Rather, the focus has been on hiring sufficient safety personnel to protect the students.
The issue of safety in schools is, not surprisingly, also divided along the Anacostia River. As seen in Figure 14, only 35% of children in Ward 8 feel safe riding a bus to school, and only 29% feel safe walking to school. In every ward except Ward 8, fewer than 7% of students reported feeling “not safe” walking or riding the bus to school, while in Ward 8, 10% or more reported feeling “not safe.”
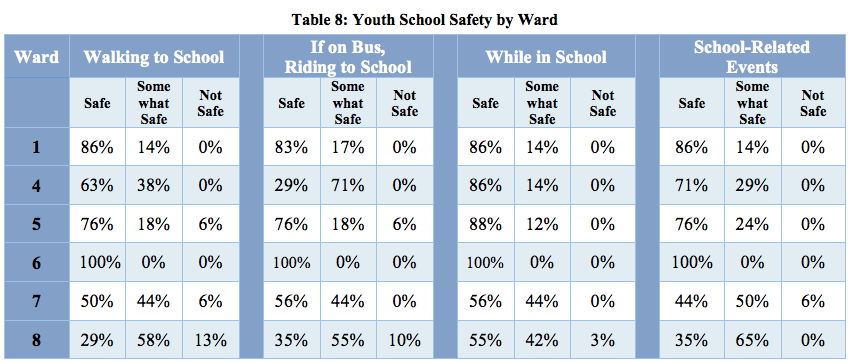
Figure 14: Youth school safety by ward. Source: Community Preservation and Development Corporation, 2016.
Notably, Ward 8 was the only ward in which any students reported feeling “not safe” while in school. Even in Ward 8, only 3% reported feeling unsafe while in school. Perhaps these low numbers are because there have not been any major school shootings in recent years in D.C. What is common, however, is shootings that occur near schools.
There is an issue with children safely getting to and from school. D.C. has 120 charter schools, and getting to school for the 46% of students who go to charter schools means taking the metro or other form of public transportation (DC Public Charter School Board, 2018). In order to ensure that students are safe on their commutes to and from school, some communities have begun “Man the Block” initiatives, in which volunteers are stationed at strategic locations to help students have safe passage to and from school (Stein, 2016). These initiatives have shown to be helpful in increasing perceptions of safety among students and may help to reduce the percentage of students who feel unsafe on their commutes to school in Ward 8 (Stein, 2016).
Recreation centers can often provide a sanctuary from violence, especially for children and teenagers. For children whose parents or caretakers work during the day, recreation centers are a safer alternative than the streets to spend time after school. Recreation centers come with the added bonus of providing productive activities such as sports and art classes. The Department of Parks and Recreation (DPR) defines its recreation centers as “safe zones for children and teens [which] offer families an opportunity to enjoy special activities and events close to home” (DC Office of the Mayor, 2018). Since recreation centers are enclosed and are maintained by the city, they are unique places within the built environment in which creating a feeling of safety can be achieved regardless of the conditions of the surrounding community. Fortunately, as seen in Figure 15, recreation centers are prevalent in all eight wards, with no D.C. resident living further than two miles from a recreation center (DC Office of the Mayor, 2018).
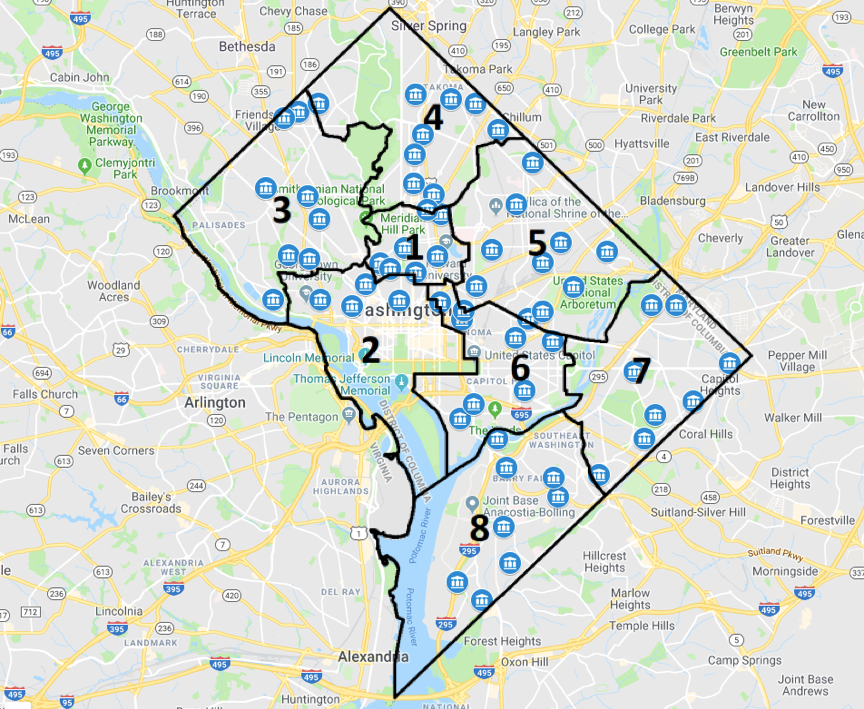
Figure 15: Distribution of Recreation Centers. Source: D.C. Parks and Recreation
Though this paper focuses on safety primarily as safety from violence, it worth noting that environmental contaminants such as asbestos and carbon monoxide can seriously endanger both the mental and physical health of residents, and should be taken into consideration when designing for mental wellness. Lead and certain types of mold have also been shown to result in behavioral and mental health problems, especially when exposed to young children (Gray, Mental health, environmental stress, social capital, and burnout, 2018). As is the case with other health equity issues, environmental hazards such as these tend to affect low-income housing at much higher rates than high-income housing.
D.C. has begun several initiatives to reduce the amounts of these toxic substances in under-served communities. Most notably, one of the action steps in Sustainable D.C. is to “eliminate environmental health threats such as mold, lead, and carbon monoxide in at least 50% of the District’s affordable housing” (Office of Planning and Department of Energy & Environment, 2012). If done successfully, this initiative will help reduce the risk of children coming into contact with these dangerous substances, and thus reduce the risk of developing behavioral and mental health issues from dangerous environmental substances for children in low-income neighborhoods.
Safe Spaces for D.C.’s Homeless Population
Safety is an important factor to consider for all populations, but especially so for people experiencing homelessness. Large homeless shelters are difficult to maintain, and pose a risk to the safety of families experiencing homelessness because security is not as tight as in smaller shelters. One strategy which has been shown to increase the safety of families experiencing homelessness is Permanent Supportive Housing, or PSH. According to the United States Substance Abuse and Mental Health Services Administration (SAMHSA), PSH is defined as “decent, safe, and affordable community-based housing that provides tenants with the rights of tenancy under state and local landlord tenant laws and is linked to voluntary and flexible support and services designed to meet tenants’ needs and preferences” (Substance Abuse and Mental Health Services Administration, 2015).
D.C.’s Department of Behavioral Health (DBH) recognizes the importance of community-based housing, especially PSH, in supporting families experiencing homelessness. In 2012, the five year Strategic Supportive Housing Plan was published, which outlined steps that the DBH would take to provide PSH for D.C.’s homeless population. Formerly, one of the biggest shelters in the city was D.C. General, which was an abandoned hospital building which was repurposed to serve as a shelter. However, with a capacity of holding 270 families, it became difficult to maintain security. In 2014, an eight year old child disappeared from D.C. General, prompting calls to close the shelter and open several smaller ones throughout the city with more humane conditions (Austermuhle, 2018). The Five Year Strategic Plan’s objectives have been implemented by the current mayor, Muriel Bowser, who pledged to close down D.C. General and replace it with smaller, community-based housing by the end of 2018 (Davis, 2015). However, construction in several of the smaller shelters was stalled, leaving many families on the streets.
PSH can also be beneficial for people experiencing mental health disorders, as it allows them to lead more independent, productive lives. According to D.C.’s Supportive Housing Strategic Plan, “PSH is known to be effective for a wide range of individuals who need intensive supports, including those with severe mental illness who are chronically homeless, those leaving long-term hospitalization, and those who are highly symptomatic.” Mirroring this sentiment, D.C. has been on the track toward moving from institutions to PSH since 2012, when the courts finally settled the 1974 Dixon case and stated that people with moderate to severe mental illness should not be forced to live in institutions and should have options for living in integrated housing (Department of Behavioral Health, 2013).
Currently, D.C. has roughly 2,434 PSH units and 675 Home First tenant-based vouchers for those in need (Department of Behavioral Health, 2013). These are not evenly distributed across the District, however, and do not cover all of the need. Though highly cost-effective, PSH programs are not self-sustaining and need the continued support of the DBH, the D.C. Department of Human Services (DHS), and specific providers (such as supportive housing programs sponsored by Department of Housing and Urban Development) in order to continue their services
Place, ageing and mental health
Though historically populated by young, working-age people, Washington D.C. is an aging city. In 2017, the median age was 34, and 12.1% of the population, or nearly 84,000 people, were aged 65 or older (United States Census Bureau, 2017). Washington, D.C. will have to adjust its future plans to account for this growing proportion of its population. The mental health of this specific population will be impacted by the urban design of D.C. and how livable it is for elderly people.
Most adults prefer to age in place. This means that they prefer to live in their own home instead of in an institution designed specifically for the elderly. In D.C., many people are choosing to stay in their communities. In order to be able to age in place, people must feel safe, comfortable, and maintain a sense of independence, regardless of their age, income or ability level (Centers for Disease Control and Prevention, 2009).
According to the 2012 United States of Aging survey by the AARP, 90% of seniors (aged 60 and older) plan to remain in their homes as they age and keep their independence for as long as possible (American Association of Retired Persons, 2012). Currently one in every three homes in America are home to a resident aged 60 or above, and D.C. is growing to mirror that statistic (Gray, Mental health, environmental stress, social capital, and burnout, 2018). As D.C.’s residents age, many will choose to stay in their homes rather than move to retirement communities.
Recognizing the increasing proportion of elderly residents in D.C. and their mental health and physical mobility needs, past mayor Vincent Gray introduced the Age-Friendly D.C. Strategic Plan in 2014. This document states the goal that “the District of Columbia will be an age-friendly city, a community that is an inclusive and accessible urban environment that encourages active and healthy aging” (DC Office of the Mayor, 2014). That document outlines several goals and strategies, including increasing access and utilization of parks, open spaces, and public buildings; ensuring accessibility of public transport to all; bolstering affordable housing programs and aging in place; and placing an emphasis on creating spaces for older adults to engage in arts, recreation, leisure, and educational activities (DC Office of the Mayor, 2014). These goals provide a solid foundation for future administrations to implement age-friendly design to ensure that all residents, regardless of age or ability, can enjoy D.C.’s active spaces.
Other considerations
Though the GAPS framework is an excellent model for observing mental health-friendly design in an urban context, there are other factors outside of GAPS which may also contribute to the mental health of populations.
One factor which has been shown to contribute to the mental wellbeing of people is light in buildings. Light plays a direct role in regulating hormone production. According to several studies, poor lighting can be an influencing factor in decreased levels of serotonin and dopamine production, which has negative implications for mental health (Roecklein & Rohan, 2005) (Moeller, et al., 2011). There are many mental health disorders which have been linked to poor lighting both indoors and outdoors, including depression, seasonal affective disorder, burnout, and Alzheimer’s (Pauley, 2004) (Gray, Mental health, environmental stress, social capital, and burnout, 2018). Furthermore, good lighting has been linked to better health outcomes even in people without mental health conditions (Partonen & Lonngvist, 2000). As public buildings and other gathering places are built and renovated, factors such as light availability and quality should also be taken into account in order to support good mental health in D.C.’s residents. This is especially important to address in buildings which are occupied D.C.’s underserved populations, such as homeless shelters.
As mental health issues continue to garner more public attention, urban planners, legislators, and other decision-makers will need to incorporate mental health into citywide building plans. These changes will have to take place as more research is conducted on mental health-friendly design. The GAPS framework is an excellent start, and hopefully it will create a springboard from which other more comprehensive frameworks can develop mental health friendly design strategies.
Strengths of Washington D.C. in urban design for mental health
Washington, D.C. has made great strides recently in publishing urban planning goals, guidelines and action items which are mental health-friendly by promoting green, active, pro-social, and/or safe place-making. Sustainable D.C., in particular, was exhaustive in its listing of goals which, if met, would have great potential to benefit the mental health of D.C.’s population as a whole.
Of the four components of GAPS (green, active, pro-social and safe space), Sustainable D.C. and other planning guides focused most heavily on creating green and active places. However, all four components are addressed in one way or another in many of the documents available to the public. Most importantly, when one looks at the deliverables that D.C. provides in terms of GAPS, it is a relatively mental health-friendly city as a whole.
D.C. has more parks per population and per city acreage than any other city in the United States. It has many recreation centers which are evenly spread throughout the city. Many parts of the city are walkable and bikeable, and have good public transit, and these areas are continuing to expand. D.C., like many cities, has pockets of violence which threaten the safety and mental wellbeing of its residents. However, it has pockets of refuge such as recreation centers and schools in which most people tend to report feeling safe.
Of the four components, perhaps the one which should be focused more on in the future is creating safe places. There is plenty of literature which discusses safety in terms of human protection in D.C. (increased police surveillance, better youth programs to keep young people out of prison, etc.), but little in terms of safety by design. Simple measures such as maintaining good lighting and visibility can significantly increase the safety of communities. Furthermore, with the creation of more walkable, mixed-use neighborhoods, people will be encouraged to spend more time in their communities, know their neighbors, and become “eyes on the street” which would further deter crime. Just as currently, safety concerns may prevent people from using the green, active, and pro-social spaces in their communities, an increase in safety would reverse that cycle and lead to more use of those spaces and, subsequently, better safety.
Weaknesses of Washington D.C. in urban design for mental health
This paper has analyzed the city- and federally-owned built environments in D.C. through the framework of Green, Active, Pro-social, and Safe places. In doing so, several patterns have become apparent.
In nearly all aspects of the GAPS framework, Wards 7 and 8, to the East of the Anacostia River, have fared significantly poorer than the rest. For the sake of comparison, in this concluding section, let us take a look at Wards 2 and 3 and see how they compare to Wards 7 and 8 with regards to each component of the GAPS framework.
Green space: Wards 7 and 8 combined have fewer local and national parks per square mile than Wards 2 and 3 combined (Figures 7 & 8). Ward 3 has an abundance of both national and local parks, and though Ward 2 has relatively few local parks, it has an abundance of national parks to make up for the scarcity of local parks. Not so for Ward 8, which is sparse in both local and national parks. Ward 7, however, has a significant number of both local and national parks.
Active space: The four neighborhoods with the lowest combined walkability, bikeability, and public transport scores are all in Ward 7 (Figure 11b). Looking at the map of walkability and public transport, Ward 8 fares poorly as well, with hardly any spots which are accessible by a 30-minute public transport ride, and few areas that are in the range of “good walkability” (score of 80 or higher) (Figures 9 & 10). By comparison, three of the five neighborhoods with the highest scores are in Ward 2, and Ward 3 is not far behind, with a large proportion of its land area showing “good walkability.”
Pro-social spaces: These are slightly more difficult to map out by ward; however, restaurant choices provide an adequate proxy for pro-social spaces. Ward 2 has the highest percentage of restaurant choices of all the wards. Interestingly, Ward 3 scores poorly in this regard, with most of area on the map showing red or lacking color, indicating poor or absent restaurant choices (Figure 12). Wards 7 and 8 fare the worst in terms of restaurant choices, with all of their land area either red or lacking color.
Safe spaces: Perhaps most chilling are the differences in perceptions of safety between Wards 7 and 8, and Wards 2 and 3. Among all of the places in the community in which perceptions of safety were measured, on average only 58% of residents of Wards 7 and 8 combined felt safe during the day (Figure 13a and b). This number dropped to 35% feeling safe at night.
These statistics are incredibly useful to demonstrate how the negative mental health effects of a low perception of safety can compound when green, active, and pro-social space utilization is taken into account. One of the measures assessed in the perceptions of safety survey was “outside on the streets in the neighborhood” and “in public places in the neighborhood like stores and restaurants,” both of which fall under pro-social spaces, since it is on the streets of the neighborhood and in public places such as restaurants that people are most likely to run into each other and increase their social capital (Jacobs, 1961). During the day, on average 50% of residents of Wards 7 and 8 feel safe in these locations, as compared to 83% on average in Wards 1 and 2 (Community Preservation and Development Corporation, 2016). Not only does this 33 percentage point difference in perceptions of safety itself have the potential to cause mental distress, but it also impacts people’s decision-making on whether or not to spend time in these spaces.
Another measure assessed was safety on public transportation, which falls under the category of active places. During the day, an average of 42% of the residents in Wards 7 and 8 feel safe on public transportation, compared to 67% of residents in Wards 1 and 2 (Community Preservation and Development Corporation, 2016). Here, the 25 percentage point difference would discourage people to use public transport during the day and push those who feel unsafe to use their cars instead, if they have one.
Also measured in the survey was perceptions of safety in parks and playgrounds in the neighborhood, which are green places. 53% of Ward 7 and 8 residents feel safe during the day, as compared to 70% in Wards 2 and 3 (Community Preservation and Development Corporation, 2016). As is the case with the pro-social and active spaces, Wards 7 and 8 lag far behind Wards 2 and 3 in terms of perceptions of safety in these areas, and could lead to a reduction in their use even if they exist in the neighborhoods. This is especially concerning since the mental health of children are implicated as well, since they are the ones most likely to use the playgrounds.
Though these statistics may seem surprising, they are a reality for the 160,000 residents of Wards 7 and 8. The potential for better urban design solutions to mitigate these negative effects is clear, and is summed up in the section on Ward 8 in D.C.’s Comprehensive Plan, which states that “the culture of drugs and violence still destroys the lives of too many youth and families in the [Ward 8] community. While the root causes of this problem are complex, greater investment in schools, libraries, child care centers, recreation centers, parks, and health clinics provides an important start toward improved public safety” (NCPC, 2016).
Sustainable D.C. recognizes that the built environment inherently increases or decreases equity by design. The goals outlined in that document aimed to improve quality of life of all residents through effective urban design, but with a specific focus on underserved communities (Office of Planning and Department of Energy & Environment, 2012). One of the actions under the “Built Environment” section is to increase affordable housing in D.C. This requires a steady flow of funding from federal and local budgets, as well as other development programs. However, this funding is necessary in order to ensure that as areas become more developed and more attractive to new residents, the existing residents are not forced to move out.
Other considerations
It is important to keep in mind the socioecological model of health when assessing any aspect that may be correlated to mental health outcomes. Through the review of the literature, this paper demonstrated the potential positive mental health benefits of having green, active, pro-social, and safe places within a city. Furthermore, through the use of maps, this paper showed possible correlation between areas of D.C. with sparse GAPS elements and poor mental health outcomes. That being said, it is of ultimate importance to keep in mind that there are many factors, from individual genetics and lifestyle choices, to social norms and economic barriers, which may contribute to a person’s mental wellbeing. It seems urban design can certainly help improve the mental wellbeing of residents, and thus where the research has shown that certain components are positive for mental health, those elements should be implemented. However, it will take more than just the inclusion of green, active, pro-social, and safe spaces to reduce negative mental health outcomes and increase positive mental health outcomes.
Furthermore, the extent to which a space must be green, active, pro-social, or safe in order to most effectively reap the mental health benefits remains yet to be seen. More research needs to be done to understand which specific components within each of green space, active space, pro-social space and safe space are responsible for better mental health outcomes, so that the definitions can be improved and narrowed where possible. For example, the definition of “green space” is varied and often broad, and it would be helpful to have a better understanding of exactly what components of green space result in better mental health outcomes. Many questions remain, such as whether grass next to the sidewalk would count as green space, or exactly how many trees per square mile would be necessary to reach a suitable threshold of better mental health.
Another area that merits further study is the synergistic effects of each of the GAPS components. For example, a researcher might question whether active spaces that are also green benefit people more than green and active spaces, separately. If so, then the design for an outdoor gym within a park may be chosen over one for an indoor gym in addition to a park. These questions seem trivial, but have real applications if urban planners are to begin explicitly implementing mental health-friendly design into city design.
Conclusion
Lessons from Washington that could be applied to promote wellbeing and good mental health through urban planning and design in other cities
1. City leadership that prioritizes urban planning and design for mental health and wellbeing gives a remit to planners and designers through goals and guidelines which can strategically and meaningfully increase citizens' access to features that support their mental health.
2. Walking, cycling and using public transport may not be realistic choices for people unless routes and infrastructure are safe, accessible, and well-connected across the entire city; beware of creating further inequity in low-income areas.
3. Urban planning and design features that promote positive social interaction and the development of social capital should extend throughout the city and be walkable from all homes.
3. City assets like open parkland should be maximised for mental health benefits through flexible use to provide access to nature, physical activity, and positive social interaction in safe settings.
Recommendations for Washington to improve public mental health and wellbeing through urban planning and design
1. To maximize potential mental health benefits of green space, active transport and positive social interaction, access to these design and planning features should be equitably accessible throughout the entire city; currently residents in Wards 7 and 8 are less able to benefit from these features.
2. Increasing people's feelings of safety in the course of their daily lives would enable them to better benefit from the urban planning and design features that promote and support good mental health and wellbeing. Safety should be an explicit part of urban planning and design policies and guidelines to promote and support good mental health, and again to maximize benefits, this should be equitable across the entire city.
Strengths and Limitations
This paper has provided an analysis of D.C.’s federal- and district-owned urban landscape through the lens of Green, Active, Pro-social, and Safe places, as well as a look at the mental health indicators of the city. It is the first of its kind to broadly examine the relationships between urban design and mental health in D.C. The paper has several strengths and limitations, which are outlined below.
One strength is that as this is the first academic paper to attempt to map out D.C.’s urban design and mental health using the GAPS framework, it sets the stage for other academics to then delve into particular components of GAPS and other urban planning and design variables as they apply to D.C. Another strength is that this paper takes into account viewpoints represented by a broad range of stakeholders, including interviews with representatives from the Department of Transportation, the Office of Disability Rights, and the Department of Behavioral Health. Third, this paper provides clear mapping of a variety of indicators that fall under GAPS categories, and each map is overlaid with D.C.’s division of wards. This gives a clear visual of which areas of D.C. have an abundance of GAPS components, and which areas are lacking. Finally, this paper provides comprehensive statistics on the mental health burden of disease in the city as a whole, as well as by ward wherever possible. Since several of these statistics are also mapped by ward, comparisons can be easily made between wards with regards to GAPS and mental health indicators.
There are also limitations to this paper. For one, mental health still is not on the same policy agenda level as physical health. Mental illness is harder to see that physical illness and the social and economic costs of untreated mental illness are more difficult to calculate (but still possible). The result is that there are not as much data on mental health as physical health, which can make mapping mental health particularly challenging. Secondly, the concept that urban design impacts mental health is still novel and emerging. Most government documents make little or no mention of mental health when making considerations for how to change urban design. The connections to mental health that do exist in government documents are mostly implicit, which makes analysis more difficult. Third, mental health is a complicated subject with many sub-categories. This paper was kept intentionally broad to show the overview of D.C.’s urban design and mental health, since as of yet there is no document which does this for D.C. Moving forward, academics should do more research into specifics about different mental health outcomes for different groups of people in the District. Finally, D.C. is unique in that some of the regulations regarding land use pertain to the city, and others to the federal government, so the urban landscape of the city is influenced by many stakeholders and can be more challenging to change. Finally, this paper focused on the land that is controlled by the city and the federal government. However, since much of the land is privately owned, research should be done to look into green, active, pro-social, and safe spaces within privately owned land in D.C.
References
2017 state of mental health in America - Prevalence data. (2018). Retrieved from Mental Health America: http://www.mentalhealthamerica.net/issues/2017-state-mental-health-america-prevalence-data
American Association of Retired Persons. (2012). The United States of Aging Survey. AARP.
Australian Government Department of Health. (2017, December 13). Feeling safe, stable and secure in your neighbourhood. Retrieved from Head to health: https://headtohealth.gov.au/meaningful-life/feeling-safe-stable-and-secure/neighbourhood
Barton, J., & Pretty, J. (2010). What is the best does of nature and green exercise for improving mental health? A multi-study analysis. Environmental Science Technology, 3947-3955.
Brandes, U. (2018, September 17). A history of urban design in D.C. as it pertains to mental health. (H. Burkly, Interviewer)
Burn, S. M. (1992). Loss of control, attributions, and helplessness in the homeless. Journal of Applied Social Psychology, 1559-1816.
Centers for Disease Control and Prevention. (2009, October 15). Healthy Places Terminology. Retrieved from CDC: https://www.cdc.gov/healthyplaces/terminology.htm
Community Preservation and Development Corporation. (2016). Perceptions of Public Safety: Report on the 2015 DC Public Safety Survey. Washington: Community Preservation and Development Corporation.
D.C. Office of the Mayor. (2018, June 24). Mayor Bowser cuts the ribbon on Petworth Meditation Garden. Retrieved from DC.gov: https://mayor.dc.gov/release/mayor-bowser-cuts-ribbon-petworth-meditation-garden
DataLensDC. (2017, March 2). A decade of demographic change in DC: Which neighborhoods have changed the most? Retrieved from DC Policy Center: https://www.dcpolicycenter.org/publications/demographic-change-d-c-neighborhoods/
Davis, A. C. (2015, March 16). Mayor Bowser spells out plan to close District’s troubled homeless shelter . Retrieved from Washington Post: https://www.washingtonpost.com/local/dc-politics/mayor-bowser-spells-out-plan-to-close-districts-troubled-homeless-shelter/2015/03/16/c2310eb6-cbe0-11e4-8a46-b1dc9be5a8ff_story.html?utm_term=.9d324424dc99
DC Central Kitchen. (2018). D.C. Central Kitchen. Retrieved from Healthy Corners: https://dccentralkitchen.org/healthy-corners/
DC Department of Mental Health. (2012). Community-Based Mental Health Action Plan for the District’s Youth and Young Adults. Washington, DC: Office of the Mayor.
DC Office of Planning. (2011). The Comprehensive Plan for the National Capital: District Elements. Washington: DC office of Planning.
DC Office of the Mayor. (2014). Age-Friendly DC Strategic Plan. Washington, DC: DC Mayor's Office.
DC Office of the Mayor. (2015). Vision Zero Action Plan. Washington, D.C.: D.C. Office of the Mayor.
DC Office of the Mayor. (2018). Anacostia Waterfront Initiative. Retrieved from Anacostia Waterfront: https://www.anacostiawaterfront.org/
DC Office of the Mayor. (2018). Department of Parks and Recreation. Retrieved from DC.gov: https://dpr.dc.gov/page/parks-and-recreation-facilities
DC Public Charter School Board. (2018). Home. Retrieved from DC Public Charter School Board: https://www.dcpcsb.org/
Dean, W. R. (2011). Food insecurity, social capital and perceived personal disparity in a predominantly rural region of Texas: an individual-level analysis . Soc Sci Med, 1454-1462.
Department of Behavioral Health. (2013). Dixon Settlement Agreement. Retrieved from DC.gov: https://dbh.dc.gov/page/dixon-settlement-agreement
Dunbar, R. M. (2007). Breaking bread: the functions of social eating. Adaptive Human Behavior and Physiology, 198-211.
Evans, G. W. (2003). The built environment and mental health. Journal of Urban Health, 80(4), 536-555.
Fletcher, K. R. (2008, April 30). A Brief History of Pierre L’Enfant and Washington, D.C. Retrieved from Smithsonian: https://www.smithsonianmag.com/arts-culture/a-brief-history-of-pierre-lenfant-and-washington-dc-39487784/
Google. (2018, October 29). Google Search. Retrieved from Google: google.com
Gray, W. A. (2018, October). Mental health, environmental stress, social capital, and burnout. (H. Burkly, Interviewer) Washington, DC.
Gray, W. A. (2018, September 17). Urban design and mental health in Washington, D.C. (H. Burkly, Interviewer)
Gullone, E. (2000). The biophilia hypothesis and life in the 21st century: Increasing mental health or increasing pathology. Journal of Happiness Studies, 293-322.
Hosang, G., & McCay, L. (2016, May). Mind the GAPS Framework: The Impact of Urban Design and Mental Health and Wellbeing . Retrieved from The Centre for Urban Design and Mental Health: https://www.urbandesignmentalhealth.com/mind-the-gaps-framework.html
House, J. S., Landis, K. R., & Umberson, D. (1988). Social relationships and health. Science, 540-545.
Jacobs, J. (1961). The Death and Life of Great American Cities. New York: Random House.
Kawachi, I., & Berkman, L. F. (2001). Social ties and mental health. Journal of Urban Health, 458-467.
Kelling, G. L., & Wilson, J. Q. (1982, March). Broken windows: the police and neighborhood safety. The Atlantic.
Lee, A. C., & Maheswaran, R. (2011). The health benefits of urban green spaces: a review of the evidence. . Oxford Journal of Public Health, 212-222.
Leyden, K. M. (2003). Social capital and the built environment: The importance of walkable neighborhoods . American Journal of Public Health, 1546-1551.
McPherson, K. E., Kerr, S., McGee, E., Morgan, A., Cheater, F. M., McLean, J., & Egan, J. (2014). The association between social capital and mental health and behavioural problems in children and adolescents: an integrative systematic review . BMC Psychology, 1-16.
Merlo, O., Bell, S. J., Menguc, B., & Whitwell, G. J. (2006). Social capital, customer service orientation and creativity in retail stores . Journal of Business Research, 1214-1221.
Mitchell, R., & Popham, F. (2008). Effect of exposure to natural environment on health inequalities: an observational population study. The Lancet, 1655-1660.
Moeller, K., Grote, V., Keller, K., Lorenz, D., Moser, M., & Khanh, T. Q. (2011). LED office lighting to promote performance and well-being. International Conference on Ergonomics and Health Aspects of Work with Computers , 68-77.
Murphy, C., & Tseu, H. (2018, October 2). Interview with former Mayor's Office staff members. (H. Burkly, Interviewer)
NCES. (2008). Schools and Staffing Survey. Retrieved from National Center for Education Statistics: https://nces.ed.gov/surveys/sass/tables/sass0708_035_s1s.asp
NCPC. (2016). The Comprehensive Plan for the National Capital: District Elements. Washington, D.C.: National Capital Planning Commission.
NPR. (2017, January 16). Old Confronts New In A Gentrifying D.C. Neighborhood . Retrieved from National Public Radio: https://www.npr.org/2017/01/16/505606317/d-c-s-gentrifying-neighborhoods-a-careful-mix-of-newcomers-and-old-timers
NPS. (2017, September 30). DC Parks. Retrieved from National Park Service: https://www.nps.gov/state/dc/index.htm
Office of Planning and Department of Energy & Environment. (2012). Sustainable DC Plan. Washington, D.C.
Office of the Mayor. (2017). About Ward 8. Retrieved from DC.gov: https://planning.dc.gov/page/about-ward-8
Partonen, T., & Lonngvist, J. (2000). Bright light improves vitality and alleviates distress in healthy people. . J Affect Disord, 55-61.
Pauley, S. M. (2004). Lighting for the human circadian clock: recent research indicates that lighting has become a public health issue . Medical Hypotheses, 588-596.
Penedo, F. J., & Dahn, J. R. (2005). Exercise and well-being: a review of mental and physical health benefits associated with physical activity . Current Opinion in Psychiatry, 189-193.
Roecklein, K. A., & Rohan, K. J. (2005). Seasonal Affective Disroder: an overview and update. Psychiatry, 20-26.
Salkow, K., & Manfred, F. (2003). Homelessness and mental illness. Current Opinion in Psychiatry, 467-471.
Scott, J. (2018). Homelessness and mental illness. The British Journal of Psychiatry, 314-324.
Stein, P. (2016, May 16). D.C. school leaders, parents call for more volunteers to ensure safe student commutes . Retrieved from Washington Post: https://www.washingtonpost.com/local/education/dc-school-leaders-parents-call-for-more-volunteers-to-ensure-safe-student-commutes/2016/05/16/d931f11e-1b8c-11e6-8c7b-6931e66333e7_story.html?utm_term=.3020abe4061f
Substance Abuse and Mental Health Services Administration. (2013). Types of illicit drug use in the past month among persons aged 12 or older. SAMHSA.
Substance Abuse and Mental Health Services Administration. (2015). Permanent Supportive Housing: An evidence-based practice. Washington, DC: US Department of Health and Human Services.
Substance Abuse and Mental Health Services Administration. (2016, July 7). Report provides rates of major depressive episodes among adolescents in every state and the District of Columbia. Retrieved from SAMHSA.gov: https://www.samhsa.gov/newsroom/press-announcements/201607071200
Substance Abuse and Mental Health Services Administration. (2016). The CBHSQ Report. US Department of Health and Human Services.
Taylor, L., & Hochuli, D. F. (2017). Defining greenspace: Multiple uses across multiple disciplines . Landscape and Urban Planning, 25-38.
The Trust for Public Land. (2017). 2017 City Park Facts. The Trust for Public Land.
Ulrich, R. S. (1993). Biophilia, Biophobia, and Natural Landscapes. In S. R. Wilson, The Biophilia Hypothesis (pp. 73-137). Washington, D.C.: Island Press.
United States Census Bureau. (2017). Washington, DC. Retrieved from Census Reporter: https://censusreporter.org/profiles/16000US1150000-washington-dc/
University of Washington. (2018). GBD Compare: District of Columbia. Retrieved from Institute for Health Metrics and Evaluation: https://vizhub.healthdata.org/gbd-compare/
Vuckovic, M. (2017). Social Determinants of Health. (H. Burkly, Interviewer)
Walk Score. (2018). Living in Washington D.C. Retrieved from Walk Score: https://www.walkscore.com/DC/Washington_D.C.
Wilson, E. O. (1984). Biophilia. Boston: Harvard University Press.
Wolch, J. R., Byrne, J., & Newell, J. P. (2014). Urban green space, public health, and environmental justice: The challenge of making cities ‘just green enough’. Landscape and Urban Planning, 234-244.
World Atlas. (2012). District of Columbia. Retrieved from World Atlas: https://www.worldatlas.com/webimage/countrys/namerica/usstates/dcland.htm
About the Author

|
Hana Burkly graduated from Georgetown University in 2019 with a Bachelor's degree in Global Health. For her senior year scholarly paper, Hana chose to focus on a public health issue close to home: the intersections between mental health and urban design in the District of Columbia. In order to better inform her research, she took courses in the Master's in Urban Planning program at Georgetown's School of Continuing Studies under the mentorship of Dr. Whitney Gray. While researching the disparities in mental health-friendly public spaces within DC's eight wards, Hana saw connections between public health and educational inequity in the region, and became determined to continue working to address those issues in DC. She joined Teach for America's DC Corps in 2019 in order to combat educational inequity and work toward TFA's vision, that one day all children will have access to an excellent education. She will be teaching High School Spanish this Fall. Hana is currently pursuing a Master's degree in Education from Johns Hopkins University.
|